Network troubleshooting at home and in small infrastructure usually looks like a pile of terminal tabs. One running mtr, one with dig, one where you are curling an endpoint to see why it feels slow. You find the answer, close the tabs, and a week later you are doing the exact same dance because nothing was recorded and nothing was watching.
The heavyweight answer is a full observability stack: a time-series database, a metrics agent on every box, a dashboards service, an alertmanager, and a weekend of YAML. That is the right call for a real production fleet. It is wildly out of proportion for a homelab, a few VPSes, or a small office where you just want to know “is the thing up, is it slow, and tell me before the user does.”
ProbeDeck sits in that gap. It is a single self-hosted container that runs network probes from your own vantage point, keeps the history, lets you promote any probe to a recurring monitor, alerts you when something breaks, and publishes a clean public status page. No external services, no build step, no agent sprawl. One Docker image, a SQLite file, done.
This is both the story of why it exists and the reference you will keep coming back to.
What ProbeDeck is, at a glance
The stack is deliberately boring: FastAPI, htmx, and SQLite, packaged as one Docker image. No Node build, no Redis, no Postgres, no message broker. State lives in a single SQLite database and a folder of per-run output files.
What you get on top of that:
- Probes. Run a network tool, watch its output stream live over a WebSocket, and keep every run in searchable history. The toolbox includes
mtr,ping,traceroute,dig,nslookup,iperf3,nmap,curlwith an HTTP timing breakdown,whois, andtcpdumpwith a downloadable pcap. There are also native in-process probes for TCP connect, TLS certificate expiry, and HTTP status assertion, plus two fan-out tools: DNS propagation and Path insight. - Monitoring. Promote
ping,mtr,iperf3,curl, TCP, TLS cert, HTTP, ordiginto a recurring monitor sampled on an interval. You get latency and loss sparklines, uptime percentages, dashboard tiles, and a detail view with a p50/p95 time-series chart and a loss overlay. - Alerts and incidents. Per-monitor rules with four shapes (above, below, loss, and down-after-N). Incidents open and close on their own, fire a webhook and a browser notification on each edge, and keep a log with duration and peak value.
- Drift monitoring. For
digand TLS cert monitors, get a one-shot alert when the DNS answer set or the certificate serial changes. - Operations. A colour-coded dashboard, a no-login public status page at
/status, maintenance windows that silence planned work, and multi-vantage probing through lightweight remote agents so you can tell “down for everyone” from “down from here.” - PWA. Installable, responsive, works from your phone.
The audience is homelabbers, self-hosters, sysadmins, and network engineers. The whole point is that it runs from your network position, not a SaaS probe in some cloud region that sees a completely different path than you do.
Install and first run
Tip: A Raspberry Pi is plenty. Every diagnostic tool is baked into the image, so the host needs nothing installed except Docker.
Requirements
- A Linux host with Docker and the Compose plugin.
- That is the whole list. No Python, no
mtr, nonmapon the host itself. They all live inside the image.
Quick start
git clone https://github.com/taffy210/probedeck
cd probedeck
docker compose up -d --build
Then open http://<host-ip>:8080.
That is the entire install. There is no build step beyond the image build, no external service to point at, and no config file you must write before it will boot.
Why host networking
By default ProbeDeck runs with network_mode: host. This matters more than it sounds. When a container sits behind Docker’s bridge, every traceroute and mtr picks up an extra NAT hop and the routing table it sees is the bridge’s, not your host’s. Running on host networking means probes originate from your machine’s real network position, with the real routing table and no bridge NAT distorting the path.
You can switch to bridge mode and publish the port instead:
# docker-compose.yml (bridge mode)
ports:
  - "8080:8080"
The cost is that one extra NAT hop in your path-based tools. For pure latency or HTTP checks it is fine; for traceroute/mtr accuracy, prefer host mode.
Capabilities and state
The container requests two Linux capabilities: NET_RAW for mtr, ping, and nmap, and NET_ADMIN for tcpdump. Nothing more exotic than that.
State persists in ./data: a single SQLite database (probedeck.db) plus the per-run output files. Back up that folder and you have backed up everything. The schema auto-migrates on upgrade, so pulling a newer image and bringing the stack back up just works.
Optional login
ProbeDeck is open by default, on the assumption that it lives on a trusted LAN. To require a login, set both of these environment variables:
environment:
  - PROBEDECK_AUTH_USER=admin
  - PROBEDECK_AUTH_PASS=use-a-long-passphrase-here
A successful login sets a signed, HTTP-only session cookie that lasts seven days. Two things stay reachable even with login enabled: the public status page (by design, it is meant to be shared) and the agent API (it is authenticated by per-vantage tokens instead).
Warning: “Open by default” means exactly that. Read the security section before you expose this anywhere but a trusted subnet.
A guided tour, by task
The fastest way to understand ProbeDeck is to run things. Here is the common path.
Run your first probe
Pick a tool, give it a target, and run it. Start with something boring and reachable:
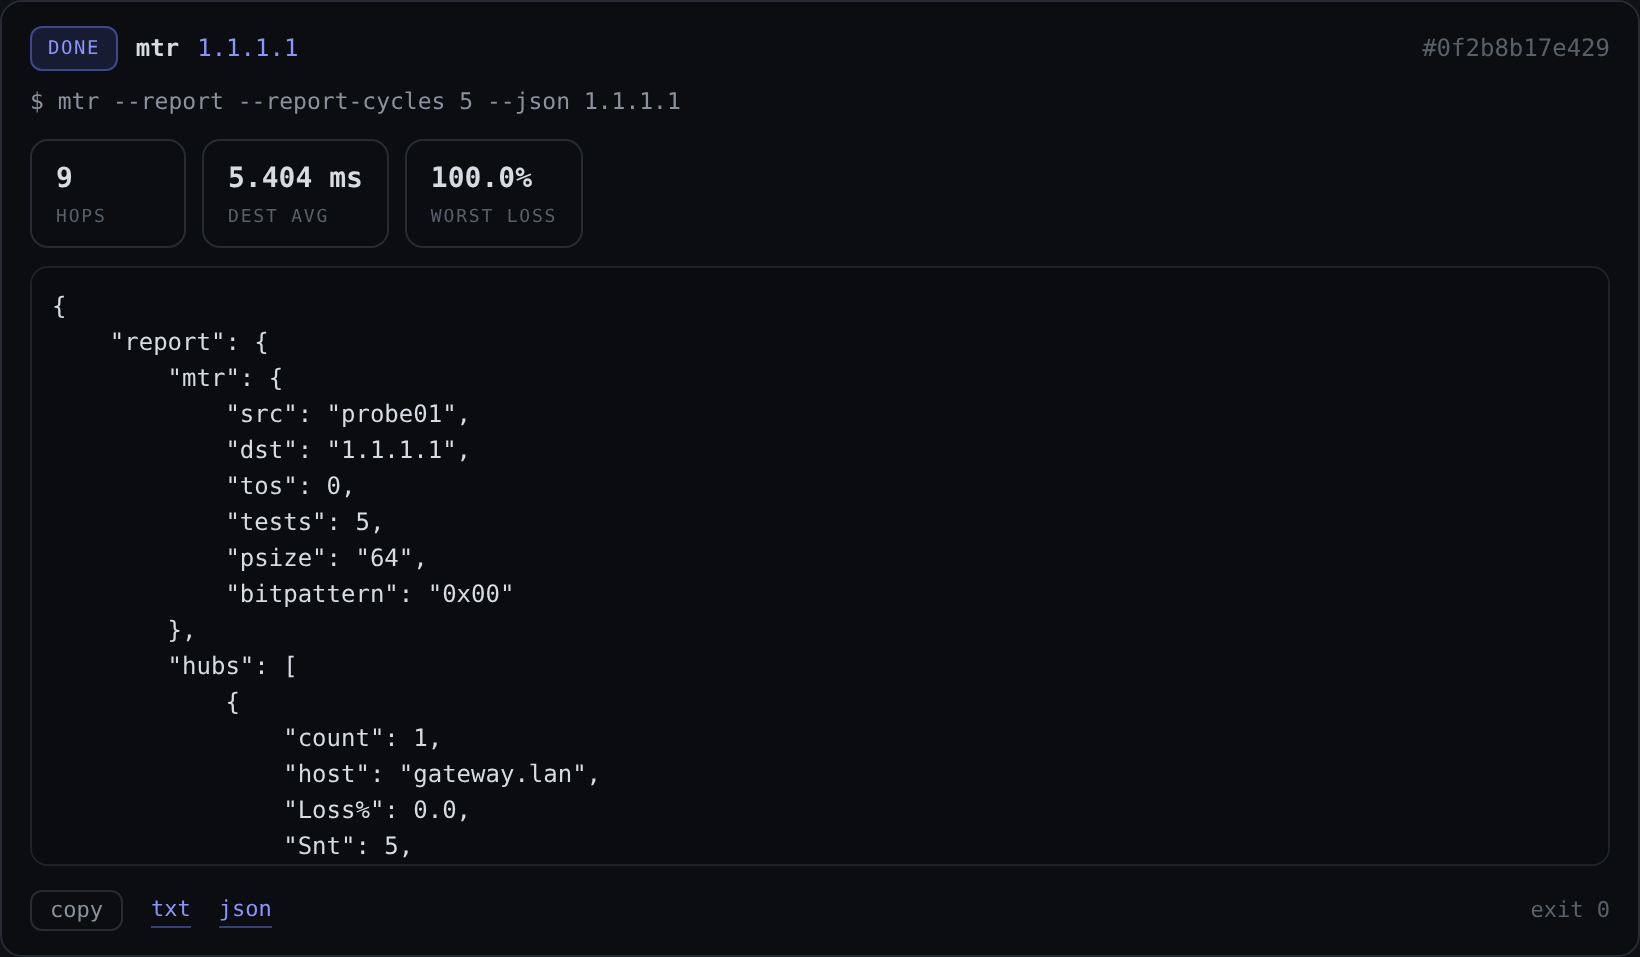
Tool:   mtr
Target: 1.1.1.1
The output streams live over a WebSocket as the tool produces it, exactly like watching it in a terminal, except it is also being recorded. Targets are validated before anything runs (see the security section), so you are limited to hostnames, IPs, and CIDRs, not arbitrary shell.
A few example targets used throughout this guide:
example.comfor HTTP and DNS.1.1.1.1for ping/mtr.github.comfor TLS and path work.
Read the results
Every run gives you a per-run summary at the top (the numbers that matter for that tool, pulled out of the raw output) and the full output below. From any completed run you can:
- Copy to clipboard the output in one click.
- Download it as
txtorjson, or as apcapfortcpdumpruns. - Re-run the exact same probe from history.
- Cancel a probe that is still running.
History, compare, and re-run
Every probe is saved and searchable. This is the part that ends the “close the tab and lose it” cycle.
Two features earn their keep here:
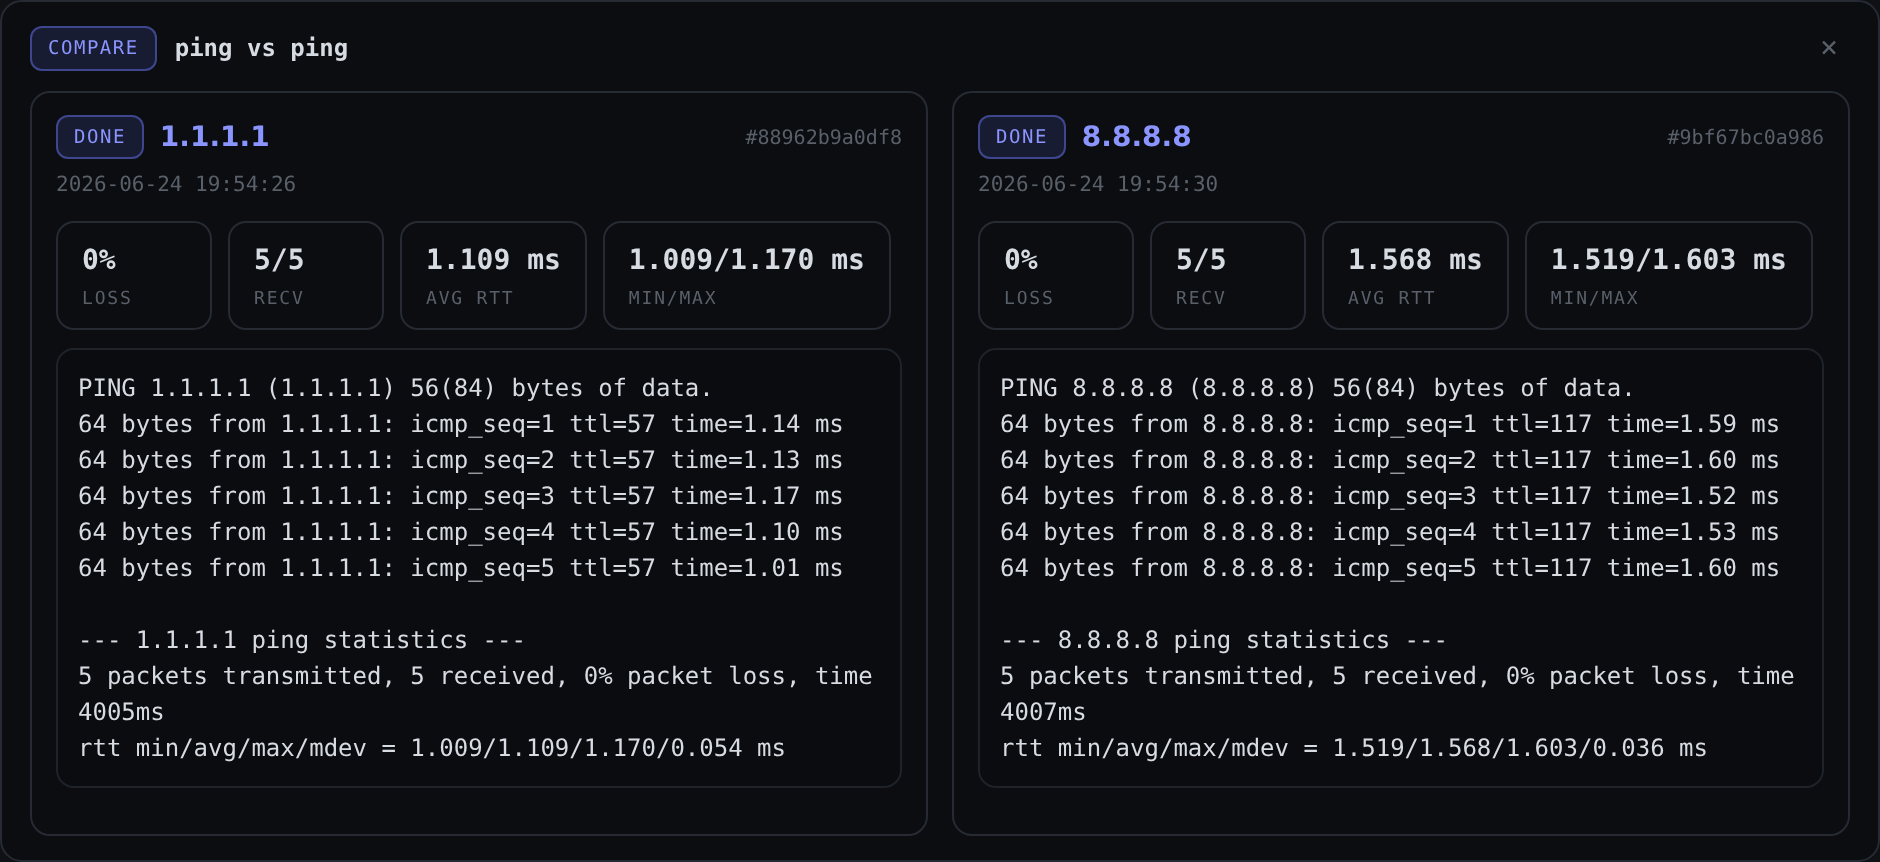
- Side-by-side compare. Select two runs of the same probe and view them together. This is how you prove “it got slower since this morning” instead of asserting it.
- Re-run from history. Reproduce an earlier probe without retyping anything.
ProbeDeck also remembers your last 5 typed targets and lets you save target profiles for the ones you hit constantly, so checking your gateway or your main domain is two clicks, not a retype.
DNS propagation
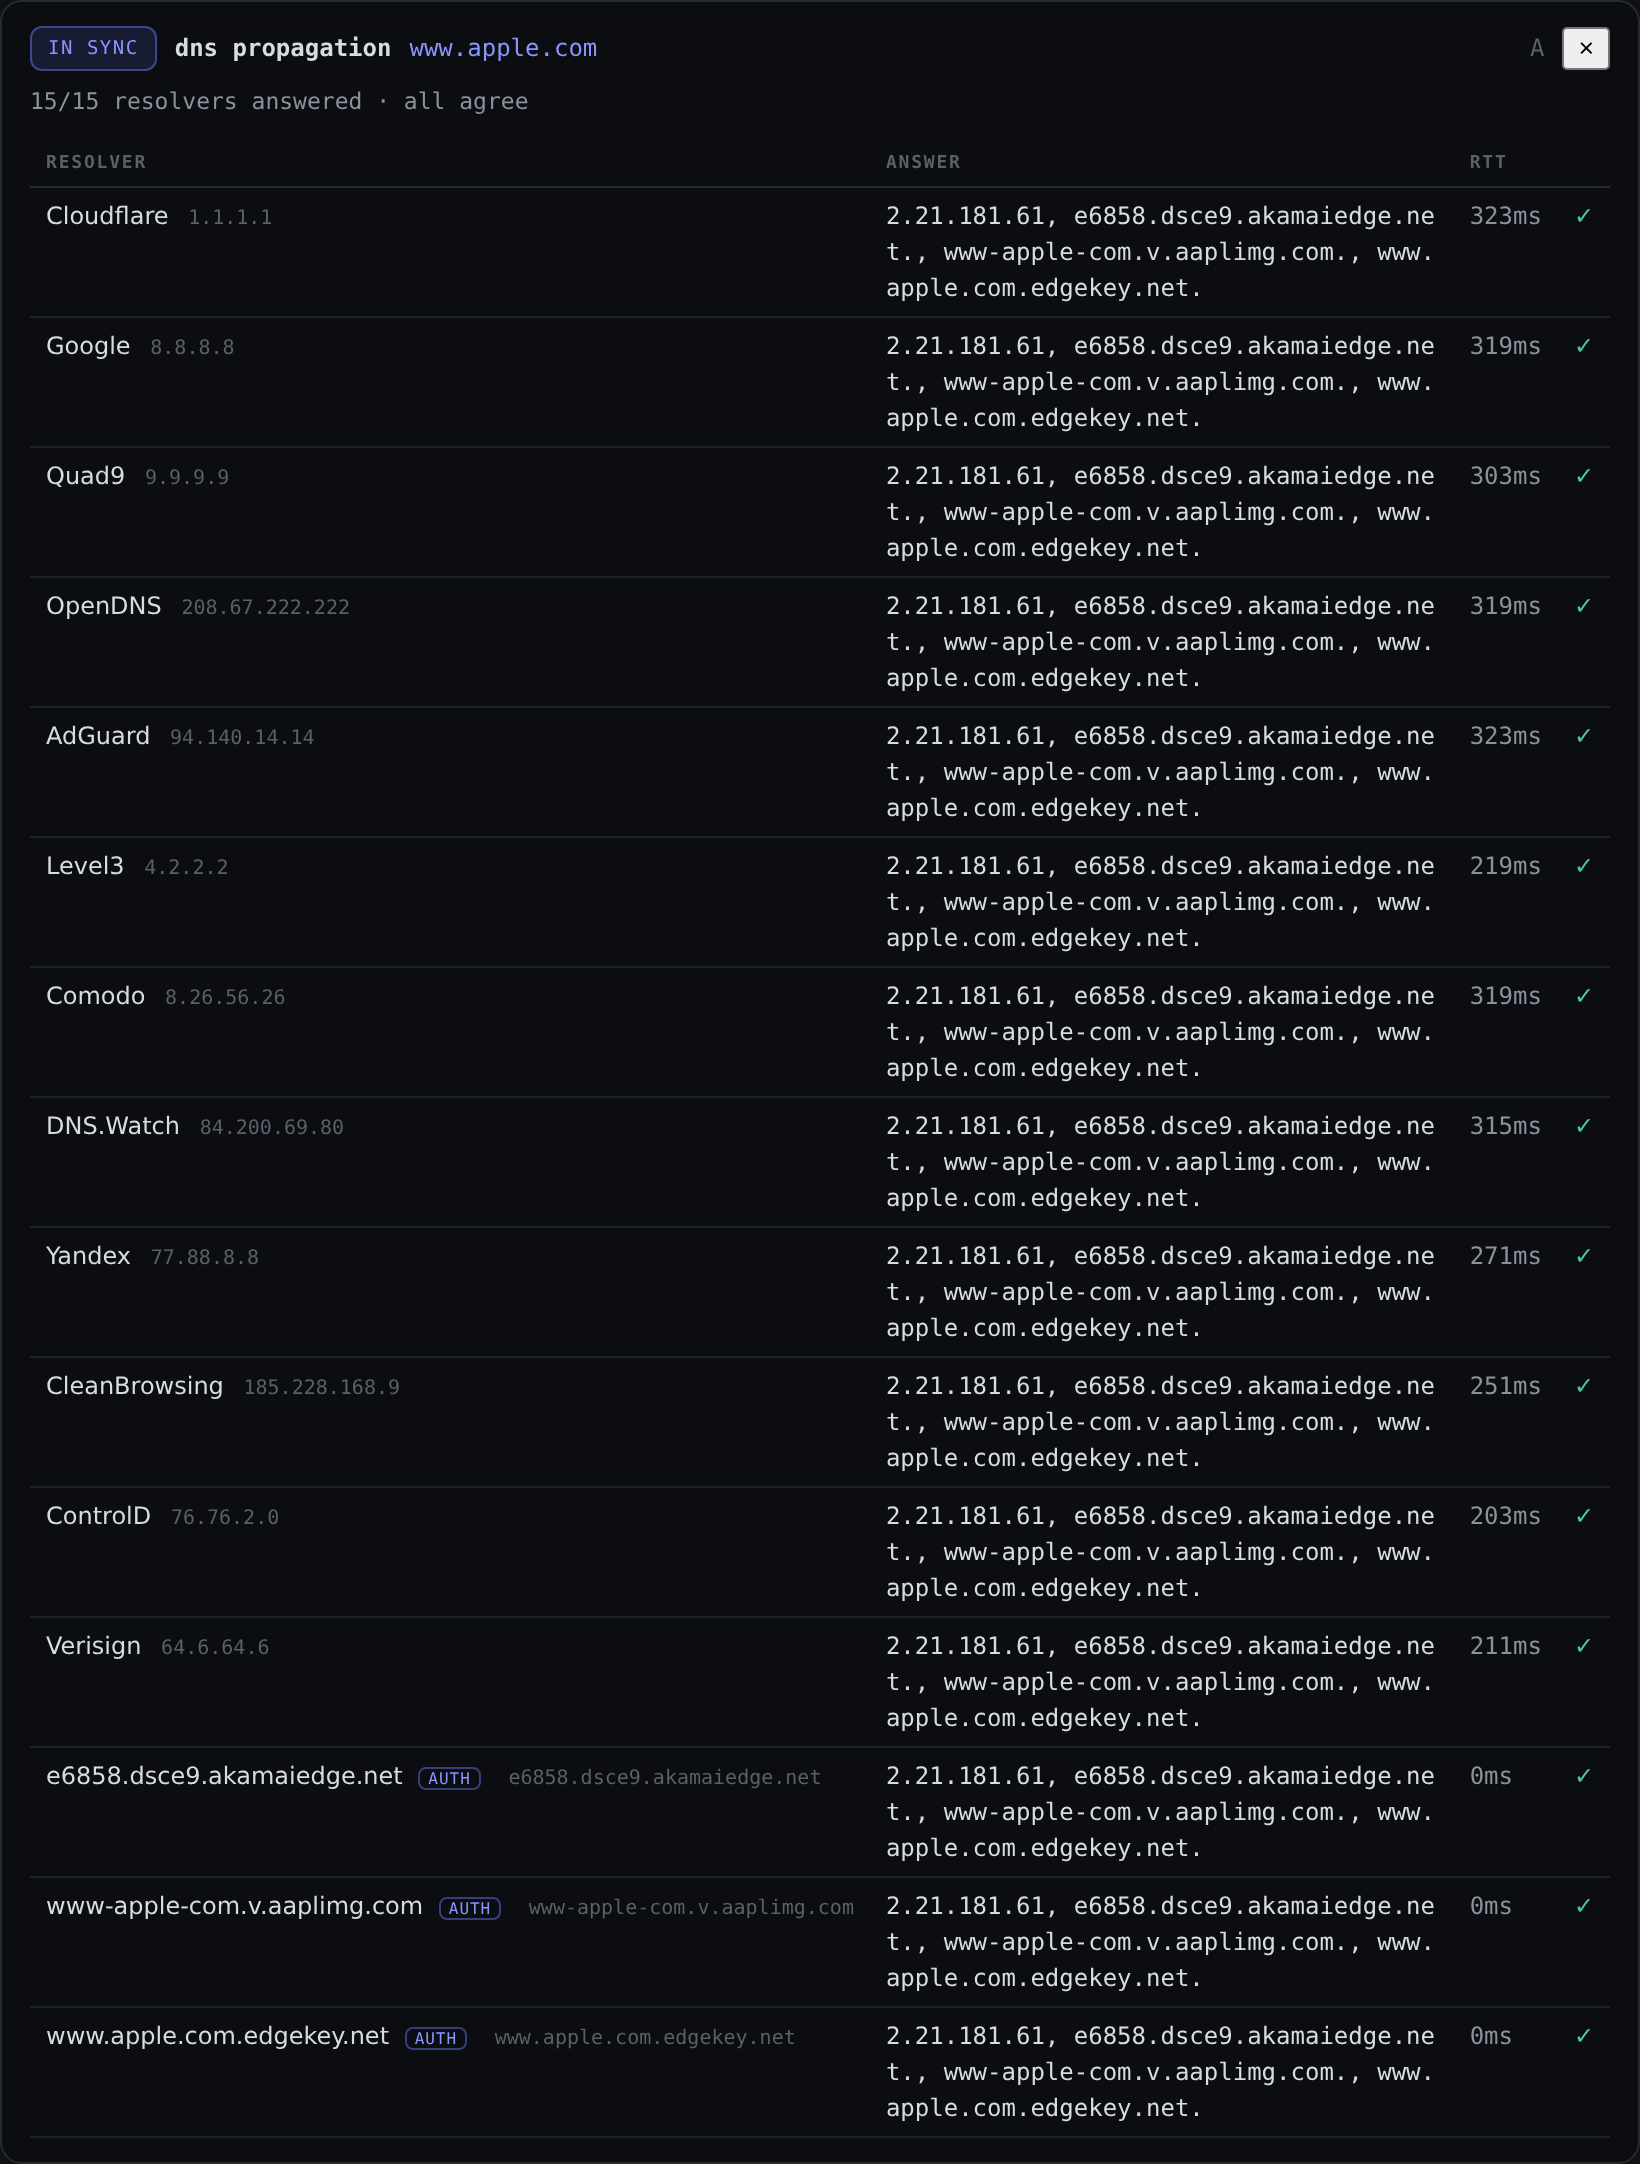
When you have just changed a record and you want to know whether the world has caught up, use the DNS propagation tool. It queries roughly twelve public resolvers plus the domain’s own authoritative nameservers, then flags any disagreement between them.
Tool:   DNS propagation
Target: example.com
If half the resolvers still hand back the old A record, you will see it called out rather than having to eyeball twelve dig outputs.
Path insight
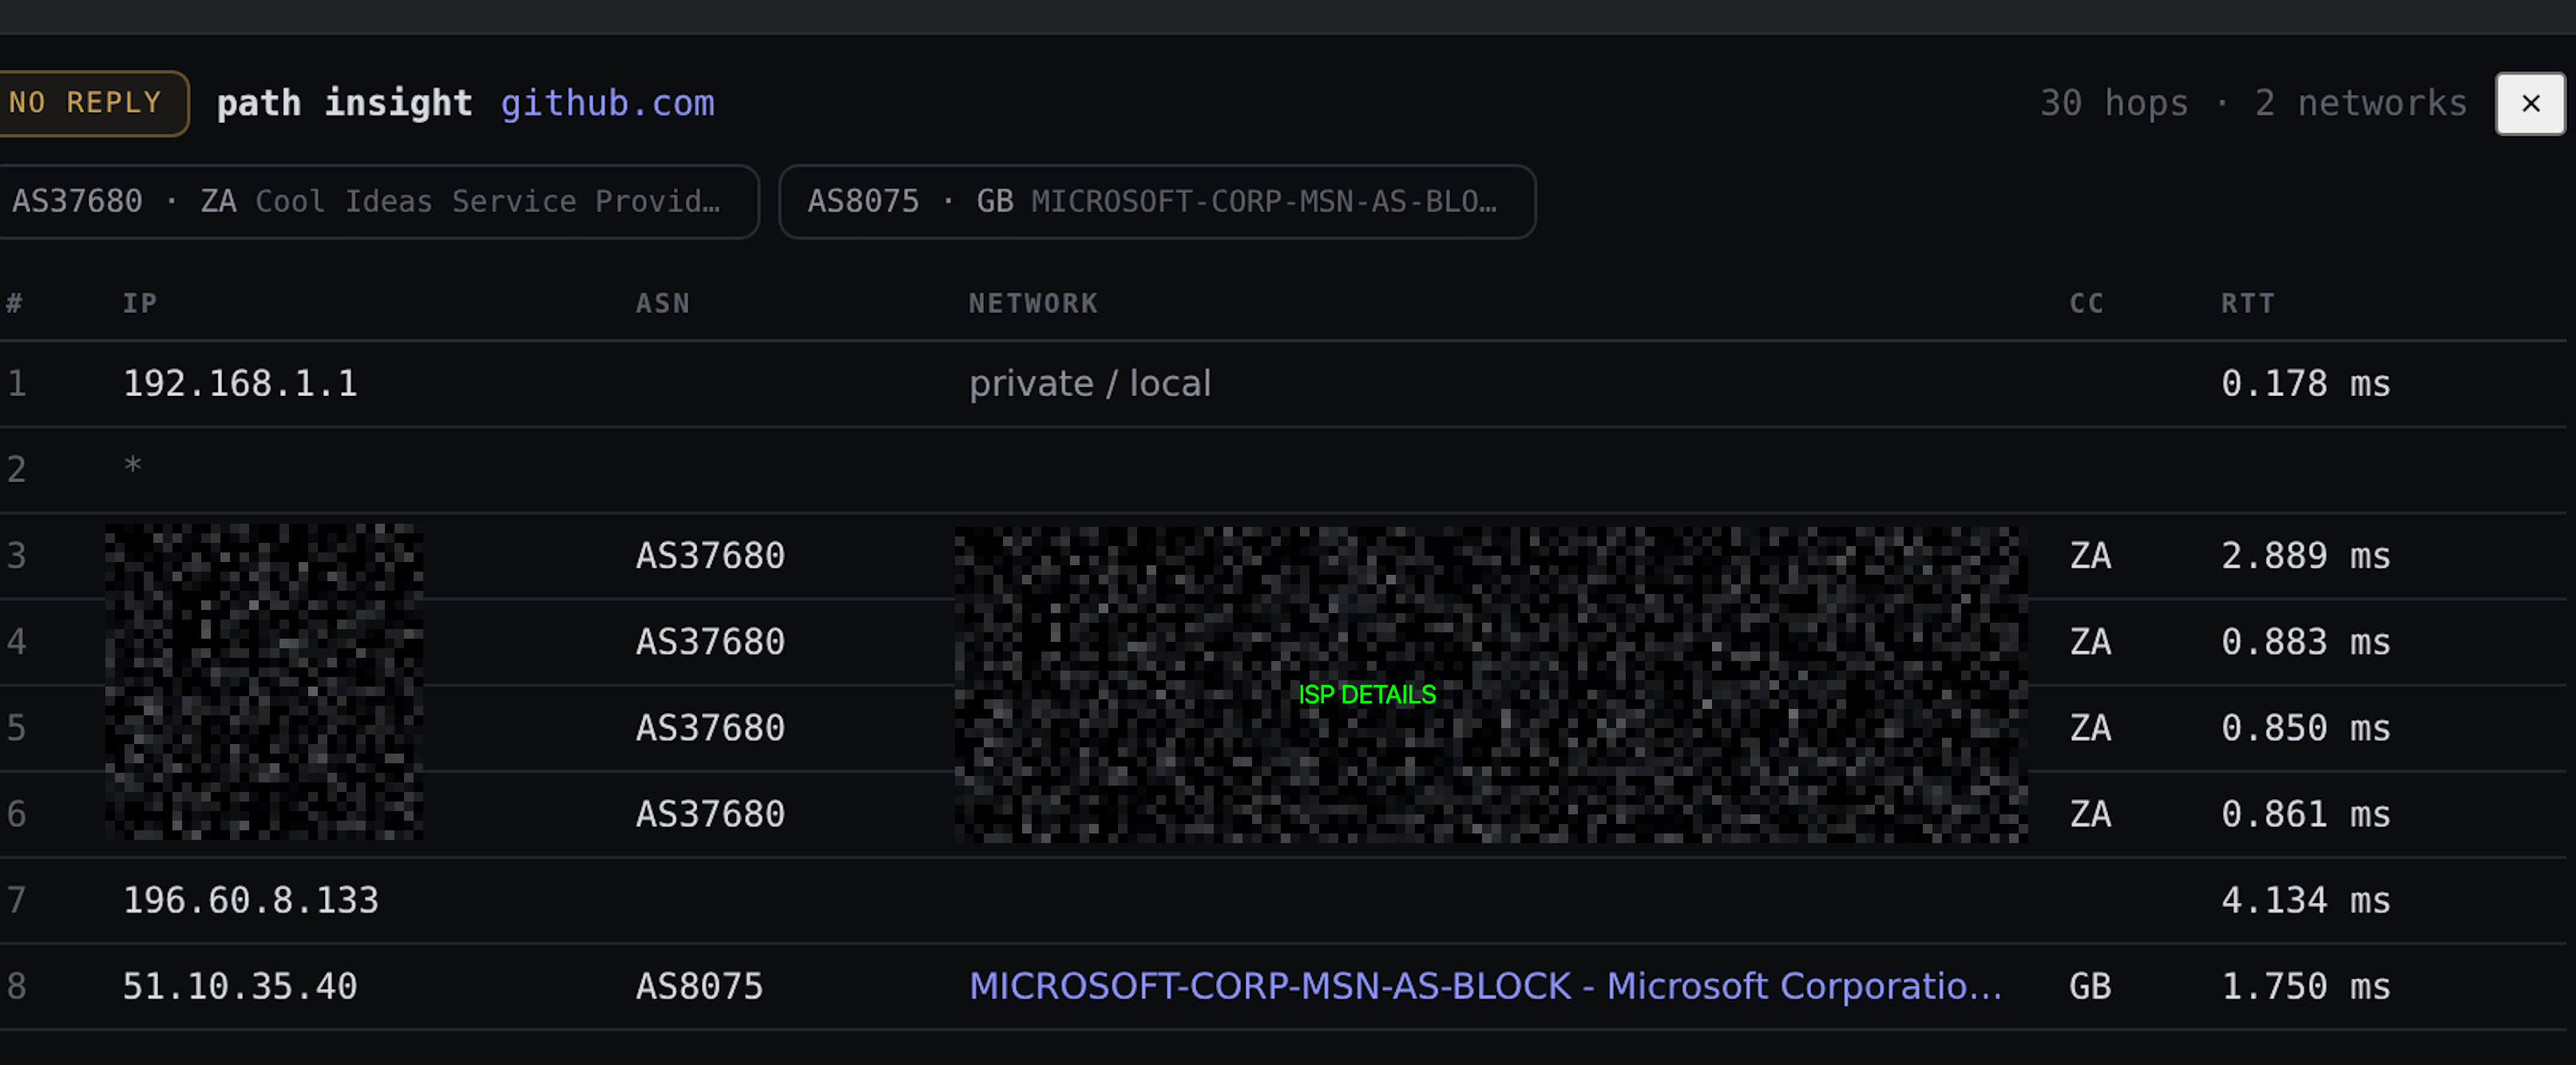
Path insight is traceroute with context. Each hop is annotated with its ASN, the network owner, and the country, resolved via Team Cymru, and the tool highlights the hop where the network operator changes.
Tool:   Path insight
Target: github.com
That operator-change hop is usually the interesting one. It is where your traffic leaves your ISP, or crosses into a CDN, or hits the boundary where a problem starts. Seeing “this is where you handed off from your ISP to a transit provider” turns a wall of IPs into an actual story.
Monitoring
A probe answers “right now.” A monitor answers “over time, and tell me when it changes.” Any of these probe types can become a monitor: ping, mtr, iperf3, curl, TCP, TLS cert, HTTP, and dig.
Create a monitor
Run the probe once to confirm it works, then promote it to a monitor and pick an interval. The available intervals are:
1m / 5m / 15m / 30m / 1h
A background scheduler samples each monitor on its own interval. A WAN-quality ping monitor might run every minute; a TLS cert expiry check is happy at once an hour or slower, since certificates do not change minute to minute.
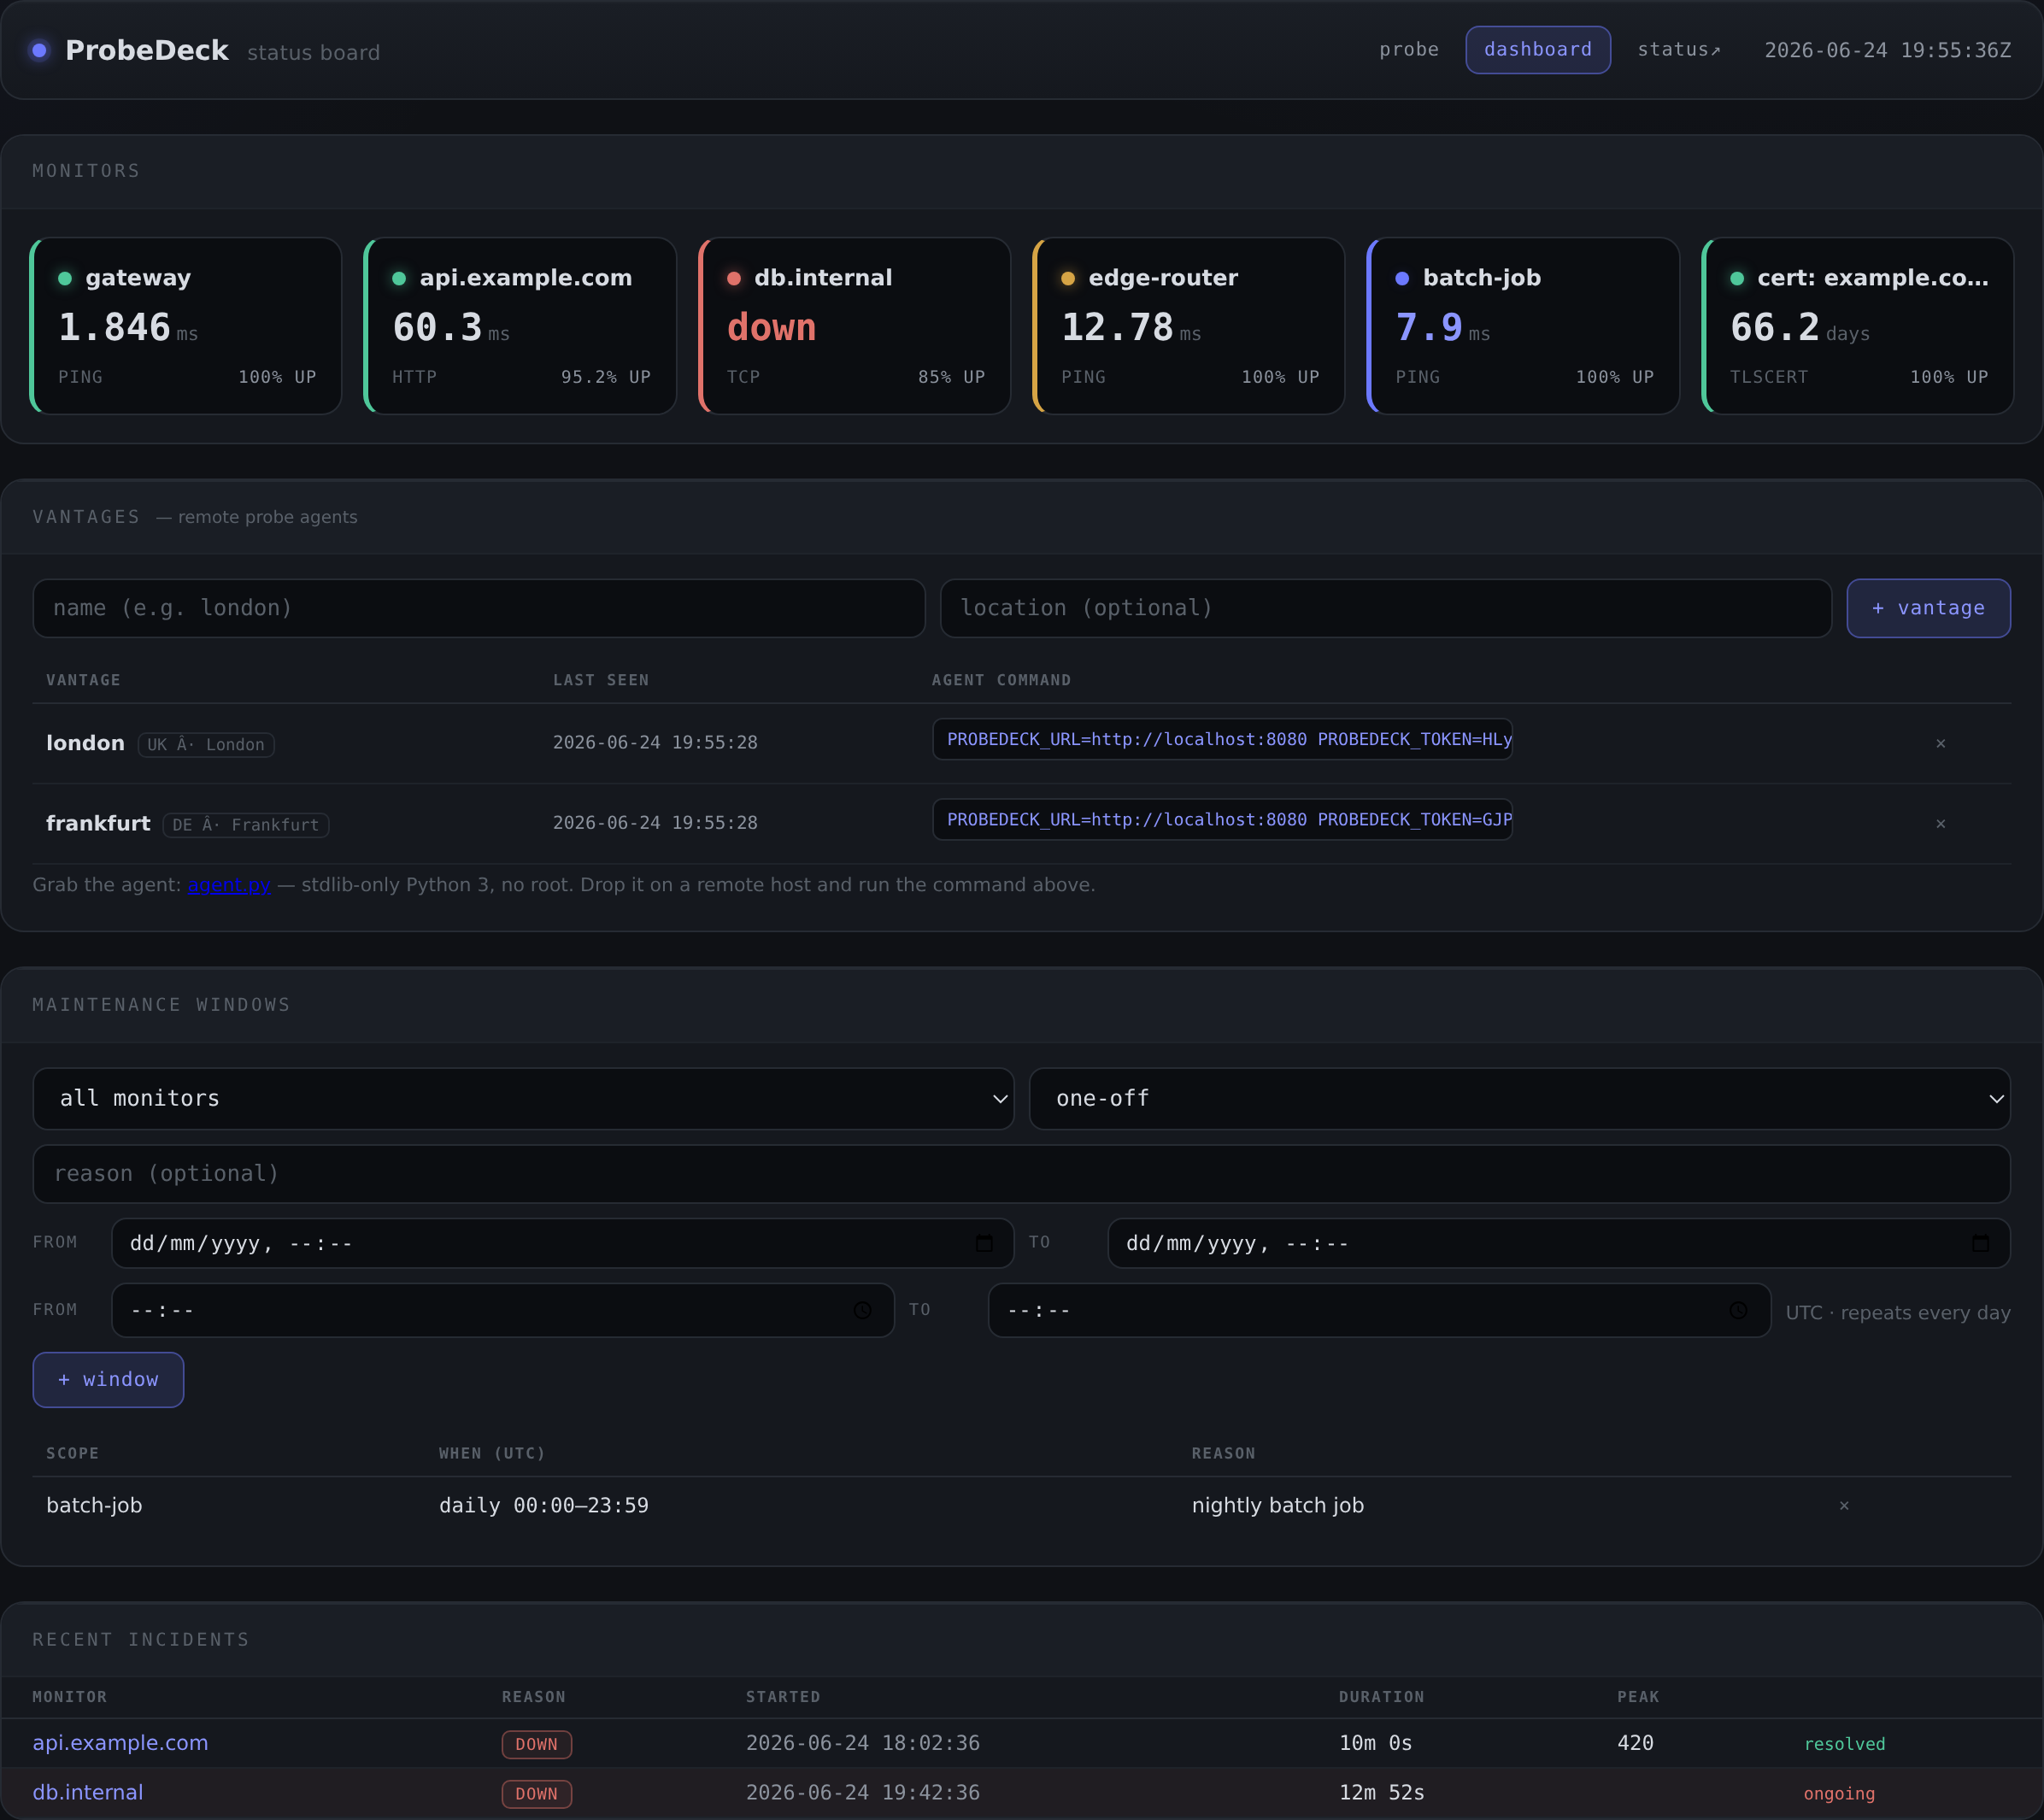
The dashboard
The dashboard is the at-a-glance view: a tile per monitor, colour-coded.
- Green: operational.
- Amber: warning (a rule is tripping but it is not down).
- Red: down.
- Blue: in a maintenance window.
Each tile shows uptime percentage and a sparkline, and clicks through to the detail view.
The detail view
The detail view is where you actually diagnose. It shows a p50/p95 latency time-series chart with a loss and outage overlay, so a pattern like “p95 spikes every evening but p50 is flat” is visible at a glance. That is the difference between “the internet feels bad” and “there is congestion on this path between 8 and 11pm.”
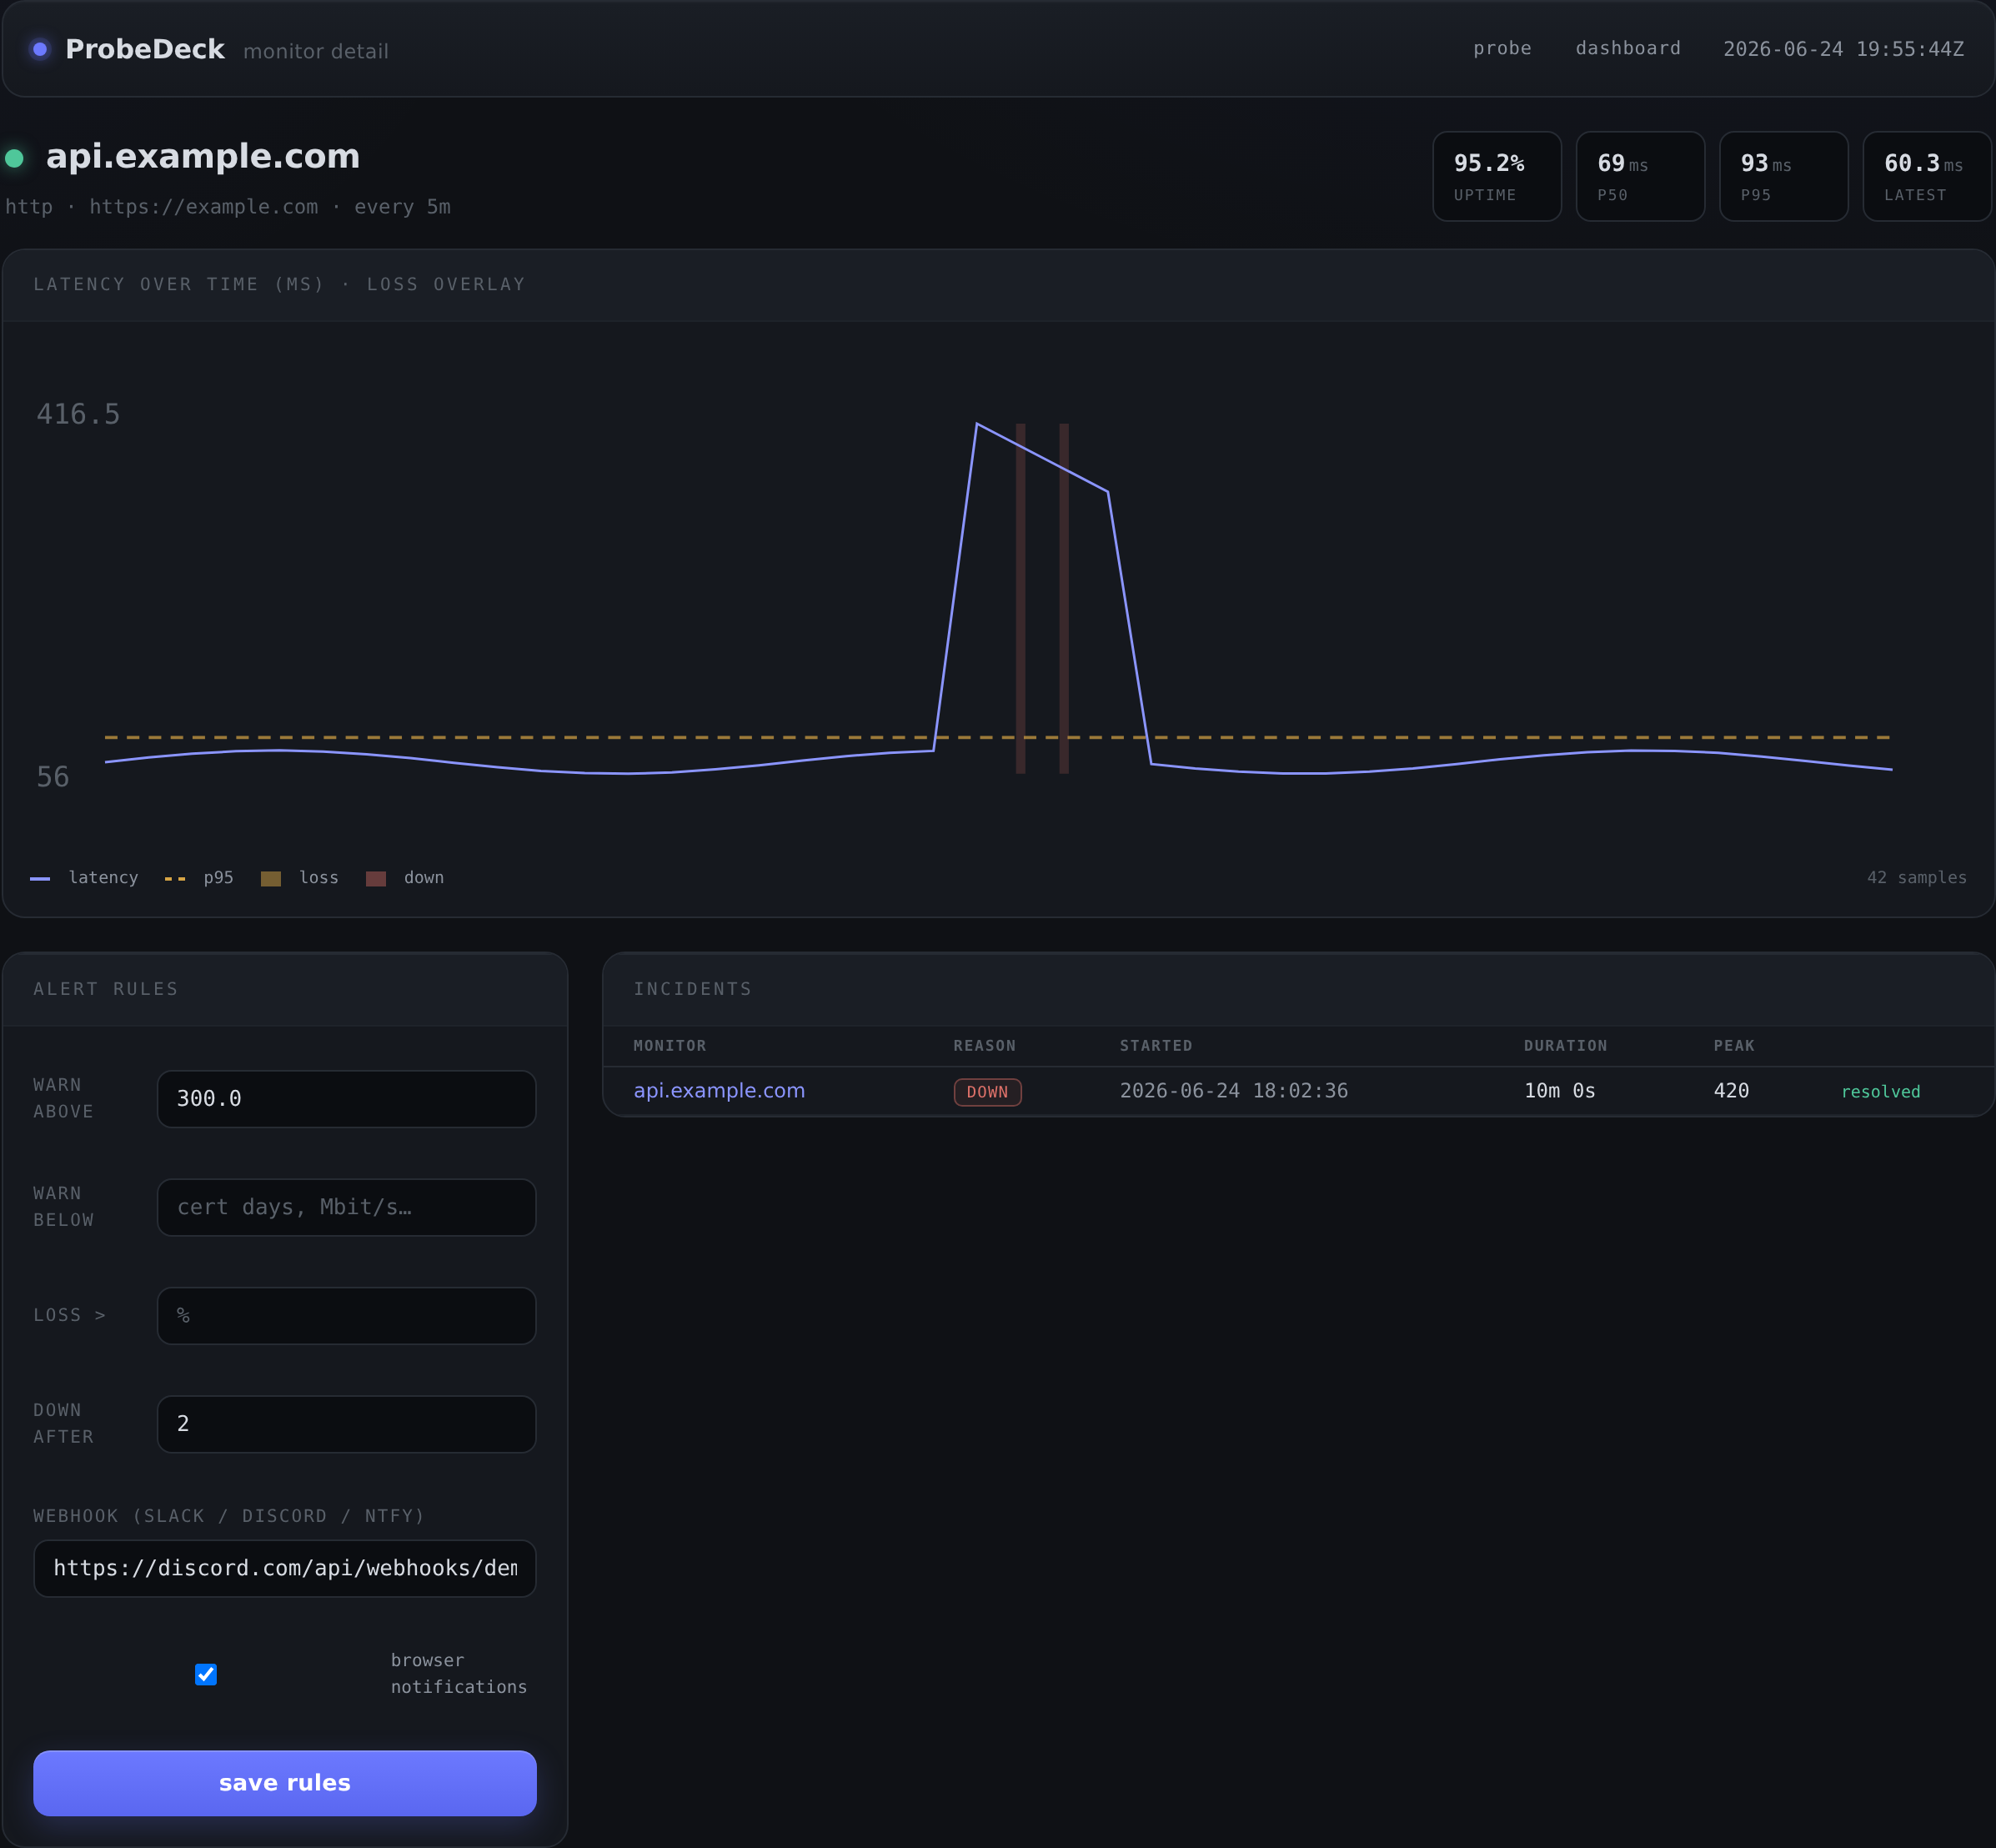
Alerting deep-dive
Monitors are only half useful if you have to stare at them. Alerts are the other half. Each monitor can carry rules, and there are four shapes.
The four rule types
1. Warn above (a ceiling). Fire when a latency or time value goes over a threshold.
Rule:      warn above
Metric:    latency
Threshold: 150 ms
Good for “tell me when my gateway ping goes above 150ms” or “alert if this endpoint’s response time crosses half a second.”
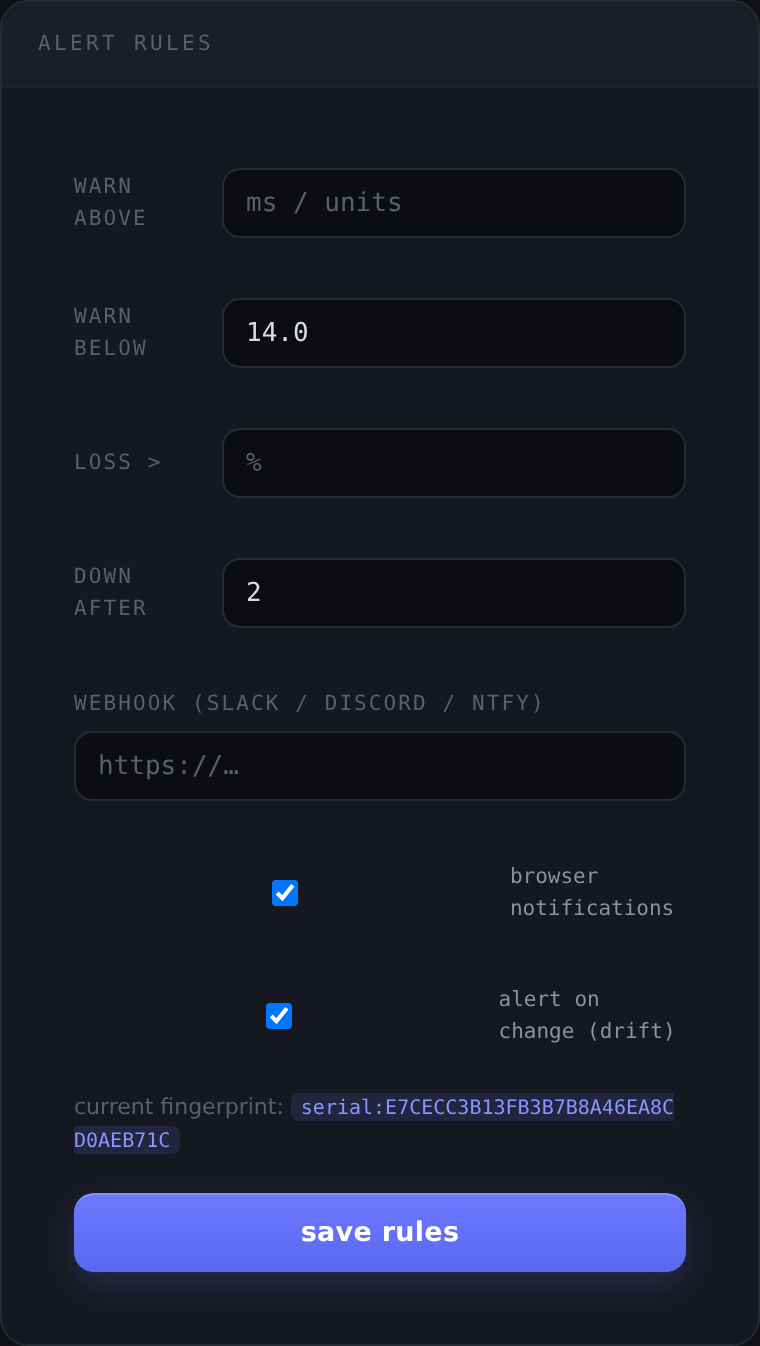
2. Warn below (a floor). Fire when a value drops under a threshold. This is the one people forget exists, and it is the most useful for the slow-burn problems.
Rule:      warn below
Metric:    TLS cert days remaining
Threshold: 14
That single rule is “warn me 14 days before this certificate expires.” Point it at github.com:443 or your own services and you will never be surprised by an expired cert again. The same shape works for iperf3 throughput: “warn me if this link drops below 800 Mbit/s.”
3. Loss greater than. Fire when packet loss crosses a percentage.
Rule:    loss >
Metric:  packet loss
Threshold: 5 %
4. Down after N checks. Fire only after a monitor has failed N consecutive samples, so a single blip does not page you.
Rule:  down after
Checks: 3
Tip: Combine “down after 3 checks” on a 1-minute interval and you get a roughly three-minute confirmation window. Long enough to ignore a transient packet, short enough to matter.
Webhooks
On each incident edge (open and close), ProbeDeck fires a webhook. One URL works for Discord, Slack, and ntfy, because the JSON payload carries both a content field and a text field, which between them satisfy the common chat targets.
Webhook URL: https://discord.com/api/webhooks/XXXX/YYYY
Paste your Discord, Slack, or ntfy webhook URL and incidents land in your channel. No per-service integration code to write.
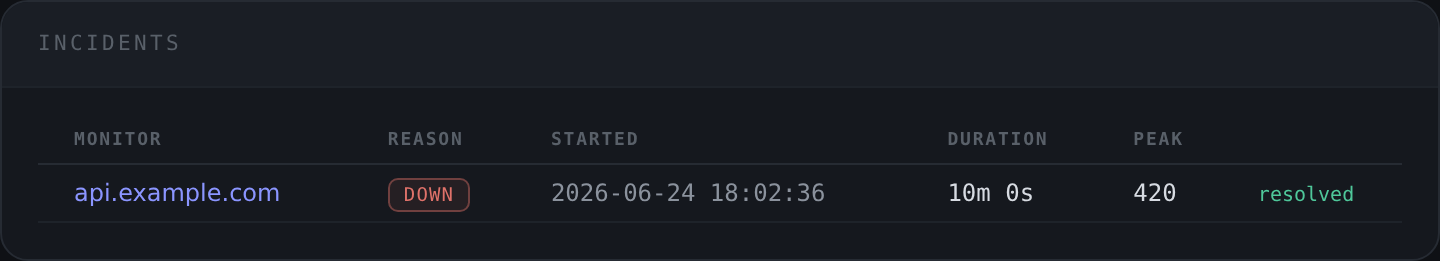
Browser notifications and incidents
Alongside the webhook, each edge fires an in-browser notification (grant the permission once). Incidents open and close automatically as the rule trips and recovers, and the incident log records the duration and the peak value, so afterwards you can see “that outage lasted 12 minutes and loss peaked at 40%” without reconstructing it from memory.
Drift monitoring
For dig and TLS cert monitors there is one more option: alert on change (drift).
Instead of a threshold, drift watches identity. It fingerprints the DNS answer set (for dig) or the TLS certificate serial (for tlscert), and fires a one-shot drift event when that fingerprint changes, carrying the old and new values.
dig monitor, drift on:
  example.com A: 93.184.216.34  ->  93.184.216.99   (drift event fired)
The first observation just sets the baseline, so enabling drift never produces an immediate false alert. After that, an unexpected DNS change (possible hijack or a teammate editing a zone) or an unplanned certificate swap (a rotation you did not schedule) shows up the moment it happens. It is a quiet, high-signal control.
Operations
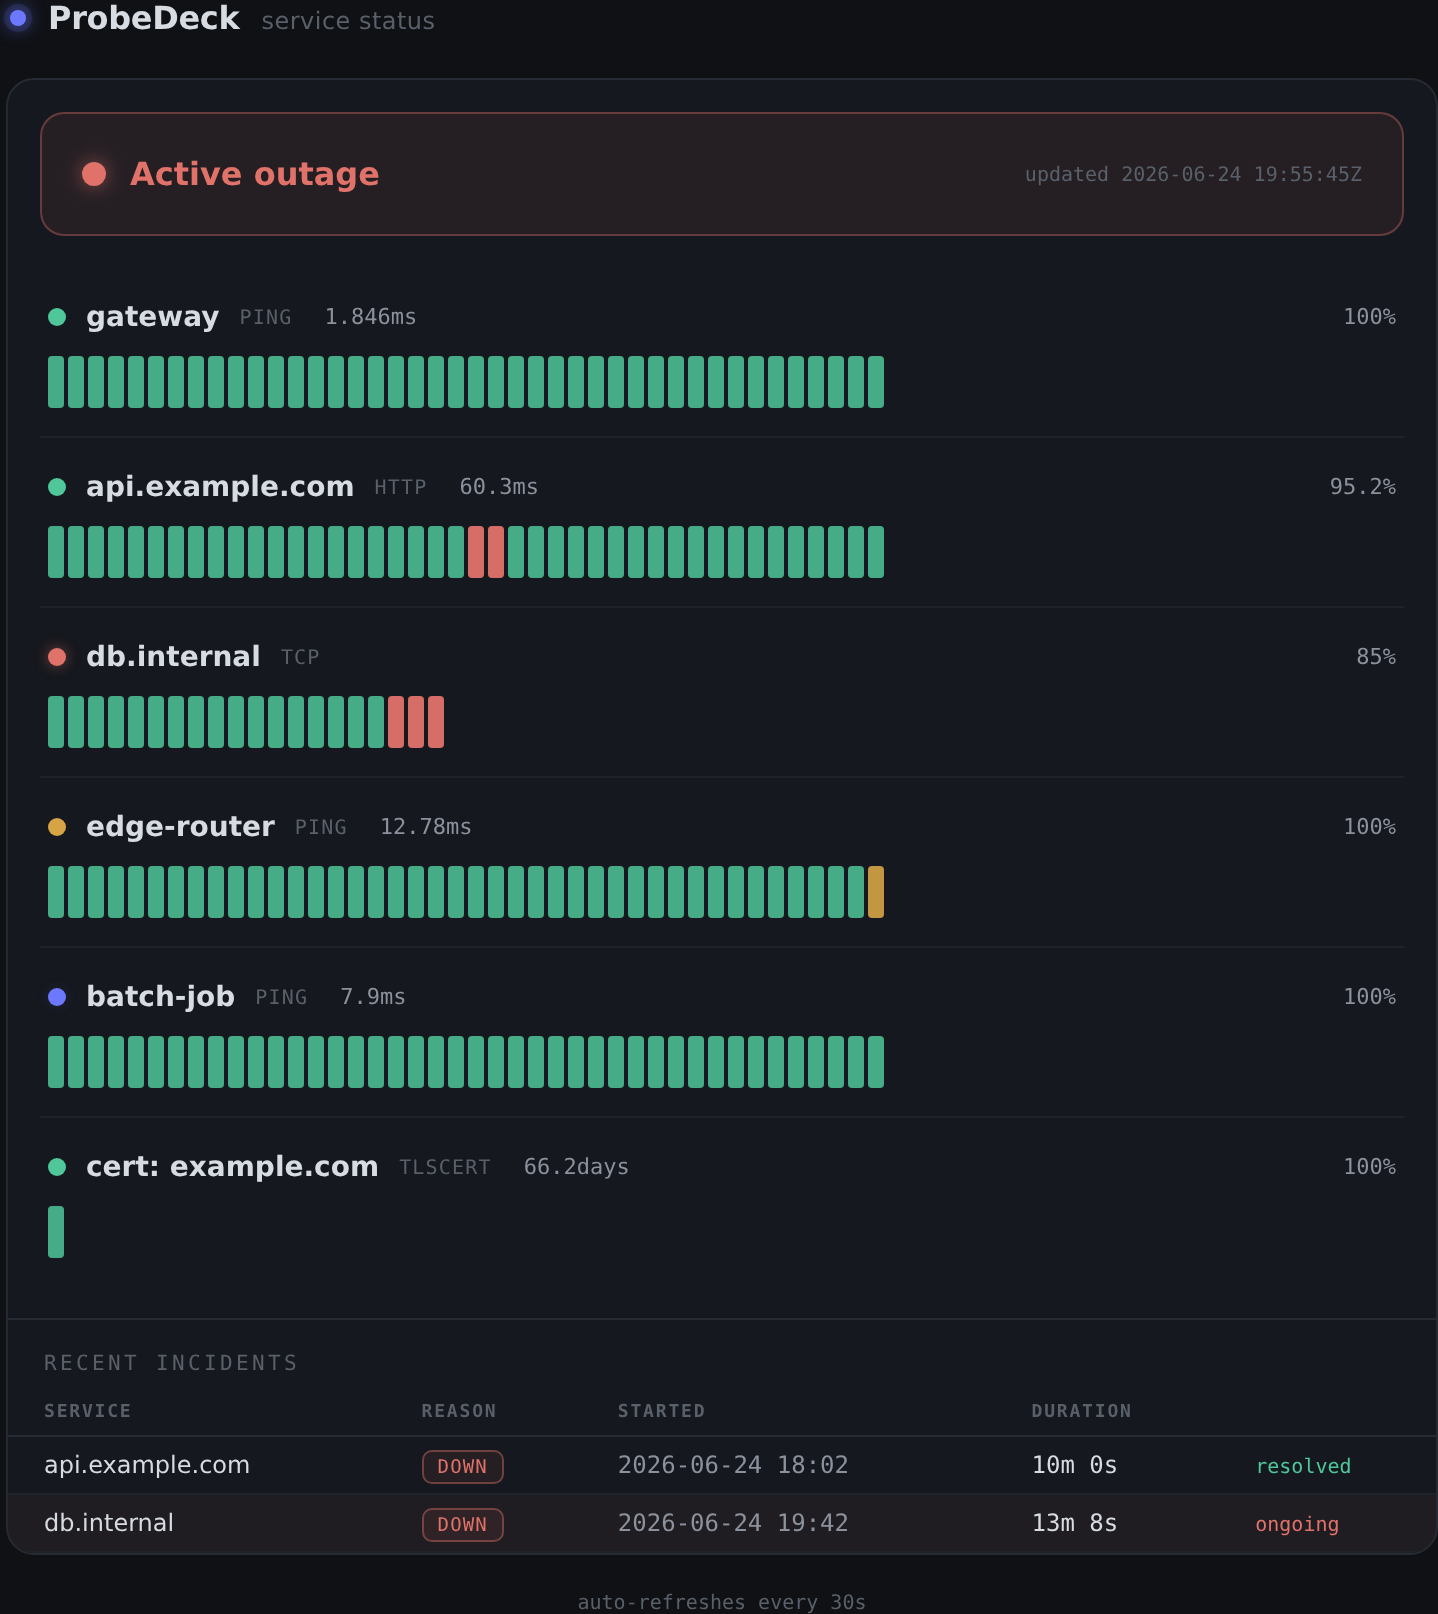
The public status page
ProbeDeck serves a read-only status page at /status that needs no login. It shows an overall banner (operational, degraded, or outage), per-service uptime history bars, and recent incidents.
The important property is what it does not show. The status page exposes only labels and uptime. It never reveals the underlying targets, ports, or probe options. You can share it with users or stakeholders without leaking your internal topology.
https://status.example.com/status -> banner + uptime bars + incidents, nothing sensitive
Maintenance windows
When you are doing planned work, you do not want an alert storm. Maintenance windows silence it. A window can be one-off or daily-recurring (in UTC), and scoped to a single monitor or to everything.
During a window:
- No incidents open.
- No webhooks fire.
- No notifications fire.
- The breach streak is frozen, so the “down after N checks” counter does not bank failures while you work. When the window ends, you do not get a flood of alerts for something you already knew about.
Tip: A daily recurring window is handy for a known nightly backup or batch job that legitimately spikes latency. Silence that monitor for the half hour it runs and stop getting paged for expected behaviour.
Multi-vantage probing
A single vantage point answers “can I reach it.” Multiple vantage points answer “can anyone reach it,” which is the question that actually tells you whether the problem is the service or your own link.
ProbeDeck does this with lightweight remote agents.
1. Register a vantage. Give it a name and location. ProbeDeck generates a token and a ready-to-run agent command.
2. Run the agent on a remote host. The agent is a single stdlib-only Python file (agent.py). No pip install, and no root needed for the TCP, HTTP, TLS, and DNS probes (ping uses the system binary). It polls ProbeDeck for jobs, runs them locally, and reports back.
# on the remote host (e.g. a VPS in another region)
python3 agent.py --server https://probedeck.example.com --token <vantage-token>
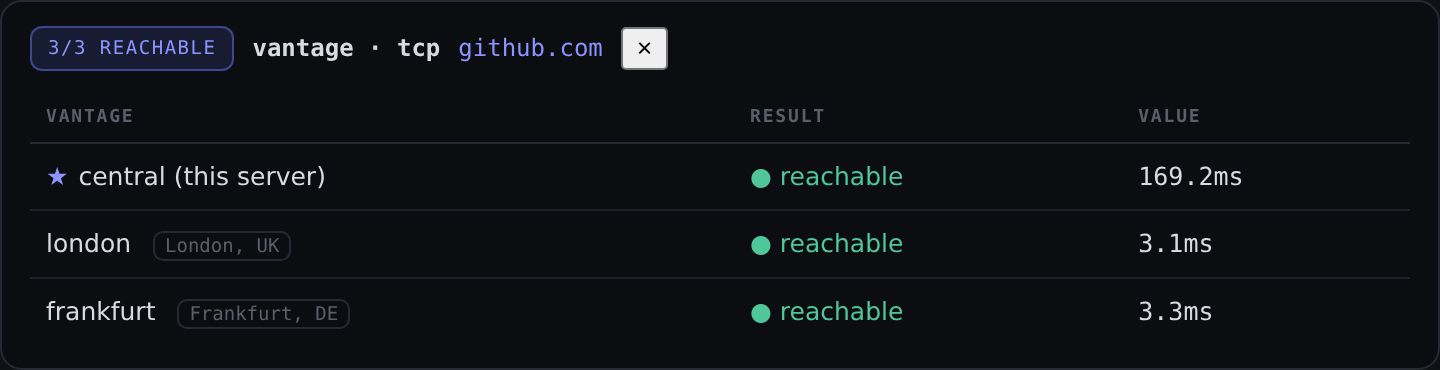
3. Run a Vantage check. A Vantage check fans a tcp, ping, http, tlscert, or dns probe out from this server and every registered agent at once, then shows per-location reachability and latency.
That side-by-side result is the whole point: it lets you tell “down for everyone” from “down from here.” If your home connection says a service is unreachable but three agents in other regions reach it fine, the problem is your link, not the service. If every vantage fails, it is the service.
Security note: Agents only ever run a fixed set of probes. They never execute server-supplied commands, so there is no path from a compromised server to remote code execution on your agents. More on this below.
Install as an app
ProbeDeck ships a PWA: a manifest, a service worker, and icons, on a responsive layout, so you can install it to a phone or desktop and use it like a native app.
Caveat: Service workers only register over HTTPS or
localhost. If you reach ProbeDeck over plain HTTP at a LAN IP, the PWA install will not offer itself. Front it with a TLS proxy (which you want anyway, see below) and the install works.
Security and hardening
ProbeDeck runs real network tools, including nmap and tcpdump, from your host. That is powerful, and it means you should understand the model and treat the UI as sensitive.
The core invariant
A target never reaches a command as anything but a validated, single argv element, and probes never touch a shell.
Concretely, every target is allowlist-validated as a hostname, IP, or CIDR before it reaches any command builder. Metacharacters, spaces, and command-substitution attempts are rejected. This validation happens for one-off runs, for monitors, for the fan-out tools, and for multi-vantage checks (where it is validated centrally on the server before any job is handed to an agent).
From there:
- CLI tools run argv-only, with no shell in the path, so there is nothing to inject into.
- Native probes (TCP, TLS, HTTP) use sockets and
urllibdirectly, no subprocess at all. - Agents run only a fixed probe set and never execute server-supplied commands. There is no server-to-agent RCE.
nmapextra args areshlex-split and screened rather than passed through.- Timeouts kill runaway tools per-tool, and
tcpdumpis packet-capped so a capture cannot run away with your disk.
What that does and does not protect
This model closes off command injection and agent RCE. It does not change the fact that anyone who can reach the UI can run nmap and tcpdump from your host’s network position. That is the intended feature, and it is also why the UI is sensitive.
Harden accordingly:
- Restrict the UI to a trusted subnet.
- Enable login by setting
PROBEDECK_AUTH_USERandPROBEDECK_AUTH_PASS. - Front it with an authenticating TLS reverse proxy if it is reachable from anywhere less trusted.
Warning: Do not put an open ProbeDeck on the public internet. Even with command injection closed off, you would be handing strangers a network scanner and a packet capture tool that originate from inside your network.
Tested and CI-backed
The project ships a stdlib unittest suite and a GitHub Actions pipeline that runs the tests and builds the Docker image on each change, so the validation logic above is covered rather than assumed.
Wrap-up
ProbeDeck is the middle path between twelve terminal tabs and a full observability platform. It runs from your own vantage point, keeps the history you used to throw away, watches what you care about on a schedule, tells you when it breaks, and gives you a status page to share, all from one container backed by one SQLite file.
If that fits your homelab or your small infrastructure, clone it and bring it up:
git clone https://github.com/taffy210/probedeck
cd probedeck
docker compose up -d --build
The repo, MIT licensed, is at github.com/taffy210/probedeck. Issues and pull requests welcome.